MCGEE TECHNOLOGY
Data - Technology - Leadership
ETL with Pentaho Data Integration
This quick guide is for those who want to get started with Pentaho Data Integration and learn the very basics. Duration is about: 15 - 20 mins.
I wrote this tutorial on the back of Dez Blanchfield's awesome demo on getting started with Apache Drill and how you can use it to run queries across a raw CSV file extracted from your LinkedIn contacts. Check it out here.
I wanted to show how you can do some basic extraction and manipulation with Pentaho Data Integration so I'm using the same source file - LinkedIn contacts extracted from your own profile.
On the first run through this could be a 15 to 20 minute affair but on subsequent passes you will be building and running transforms in no time flat.
Oh and I'm running through this on Windows 10 but you should be able to follow along just fine on Linux or Mac. Just make sure you have a working Java runtime environment.
Downloading Pentaho and Launching PDI
First off let's grab our LinkedIn contacts file. This gives us a nice dump of useful data in a standard CSV format. Dez did a great job explaining the hoops you need to jump through so I will recycle his instructions here - take it away Dez:
  		1. login to http://linkedin.com
  		2. under "My Network" in the main menu select "Connections"
  		3. click on the tiny "sprocket" on the right hand size ( mouse over label is curiously "Settings" )
  		4. click on "Export LinkedIn Connections" on the right hand side under "Advanced Settings"
  		5. now click on the blue button labeled "Export"
  		6. you will now asked to perform a droll "Security Verification" ( CAPTCHA ), enter text & click "Continue"
  		7. you will see a green bar appear announcing "Your connections were successfully exported."
  		8. then about 5 seconds later a download popup will appear
  		9. click on "OK" to start the download ( it should end up in your Downloads folder )
  		10. you've now downloaded a file called "linkedin_connections_export_microsoft_outlook.csv"
Next we need to download Pentaho Data Integration (PDI) Community Edition from this link here:
http://community.pentaho.com/projects/data-integration/
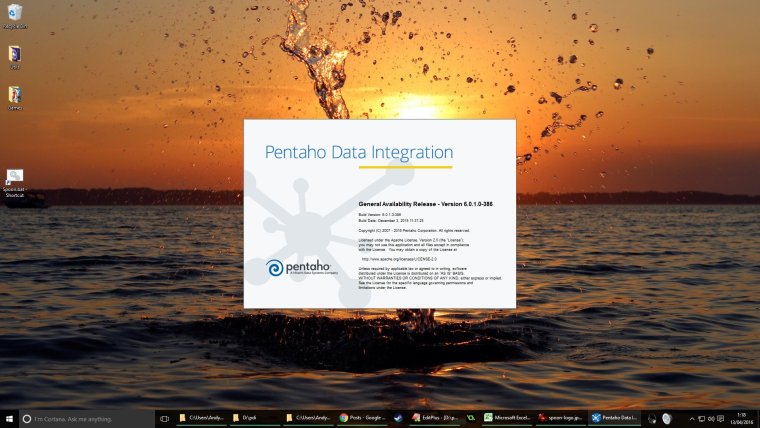
After navigating to the download section you should end up with a file called something like this:
pdi-ce-6.0.1.0-386.zip
Unzip the contents of that file into a directory somewhere. There is no installation as such and I extracted to a folder in the root of D:\ and changed the folder name from 'data-integration' to simply 'pdi' in order to keep it short and sweet.
My PDI installation is now located at D:\pdi
I've also renamed my LinkedIn CSV file to connections.csv for convenience.
PDI is still affectionately known by it's original project name Kettle. Kettle contains a number of tools: Spoon, Pan and Kitchen to name a few. We are going to be using a tool called Spoon.
The cool thing about Spoon is it allows us to design powerful data transformations in a visual manner with drag and drop capabilities. To start spoon run the bat file:
D:\pdi\spoon.bat
Linux and Mac users should find and run the equivalent shell script to launch Spoon.
Our First Transformation
In this tutorial we are going to read in data from a CSV file, manipulate it and write it out into a new format, XML. This is called a transformation and is part of a process known as ETL which stands for Extract, Transform and Load.
Once Spoon has started we need to create a new transformation. Do this by hitting CTRL+N or via the menus selecting:
File -> New -> Transformation
This will create a new transformation and a new workspace tab should appear called Transformation 1. In the View tab on the left hand sidebar, double click on Transformation 1 and the transformation properties box should appear and look like this:
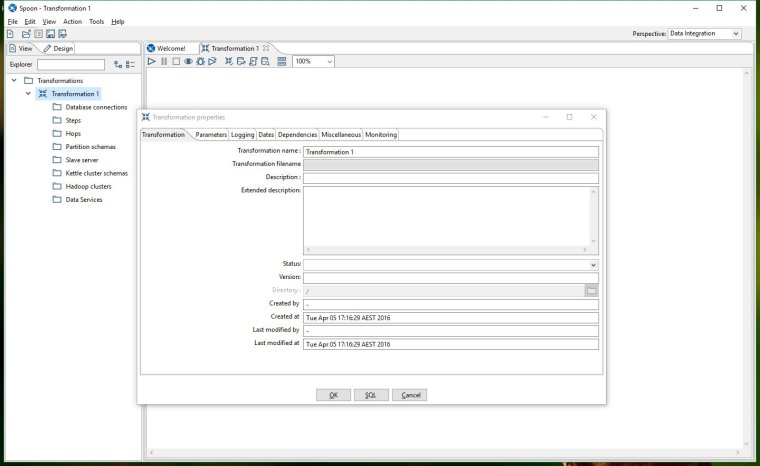
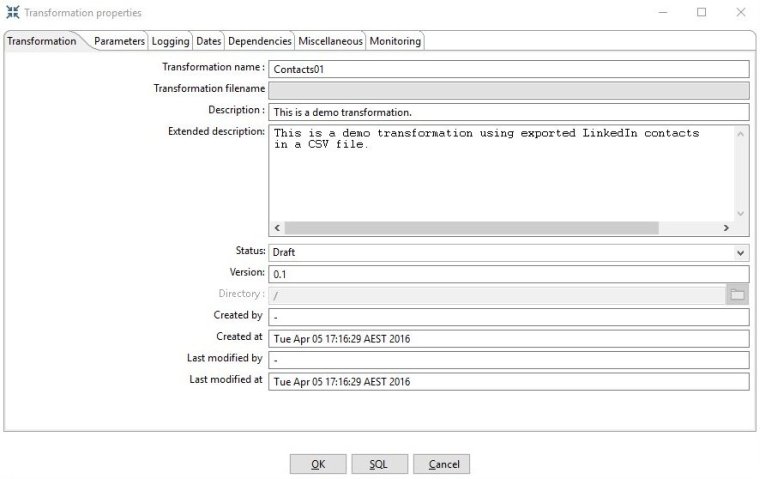
Edit your transformation name, description and other details so that it looks like the screenshot below and then click OK to close the properties window.
Now let's save our newly created transformation by pressing CTRL+S or from the menu:
File -> Save
Kettle transformations are saved with a ktr file extension. I named mine contacts01.ktr and hit the save button.
Adding Our First Step - Reading Input
On the left hand sidebar select the Design tab and you will notice a bunch of folders containing a myriad of different steps we can use. This is our Steps Palette. Click through some of them and see all the different data formats that can be read and written.
For us we want to choose a step from the input folder called CSV file input.
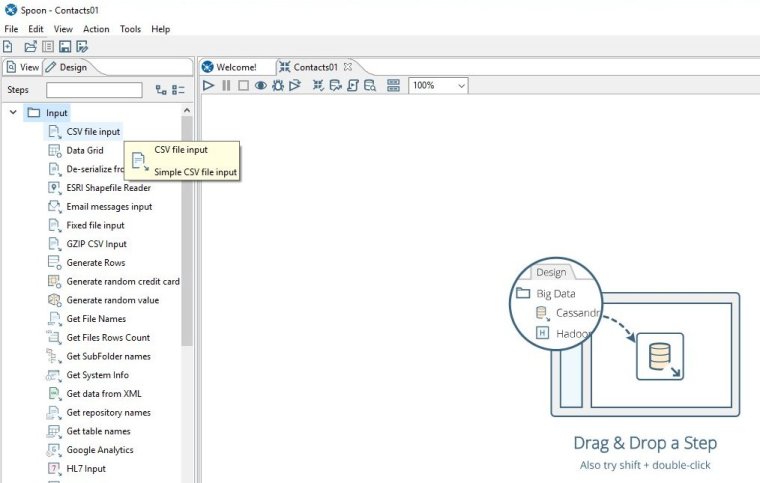
With your mouse, select and drag the CSV file input step onto an empty part of the transformation workspace. You should end up with a square icon on your workspace. Double click on this step icon and the step properties window should appear like this:
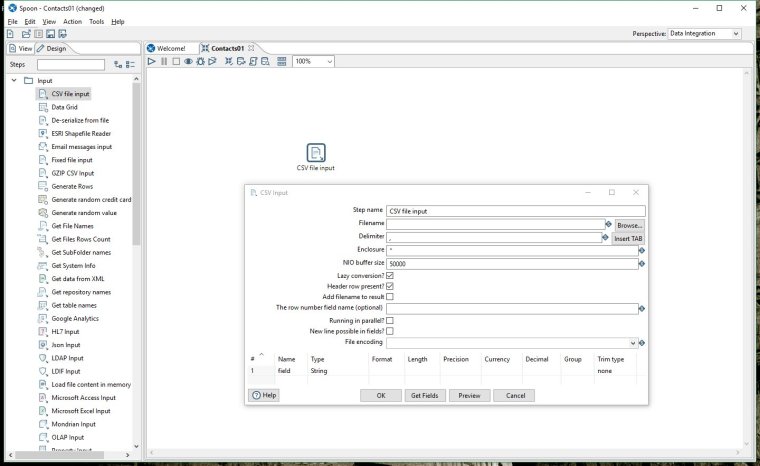
Select Browse next to the filename field and choose our connections.csv file that we saved earlier.
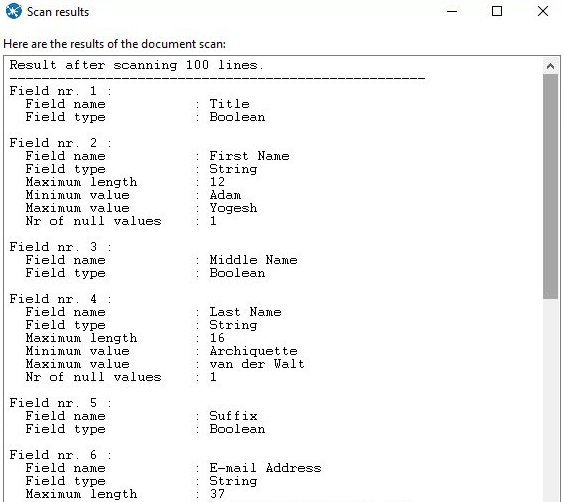
Click on the 'Get Fields' button at the bottom of the dialog box - when prompted leave the sample size as the default 100 lines. You will see the scan results.
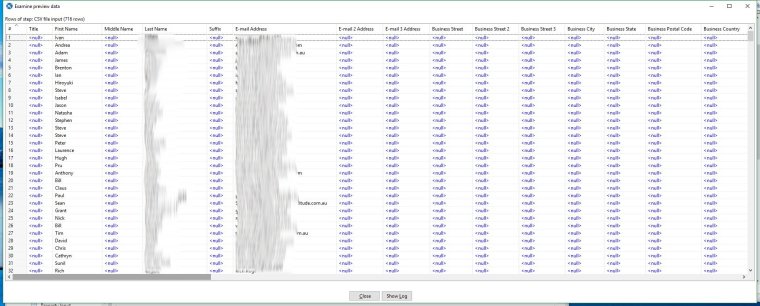
Close the scan window and now click on Preview to show us some of data - leave the default at 1000 rows. After a little processing you will get a table with rows of data from our CSV file. You can check that all the fields have been correctly identified and delimited.
Close the preview window and click OK on the CSV input step to close the step properties. Now it's time to add a new step and do some manipulation.
Adding To The Data Flow
From our Steps Palette on the left open the Scripting folder and drag the Modified Java Script Value step onto our workspace. Position it to the right of our original step.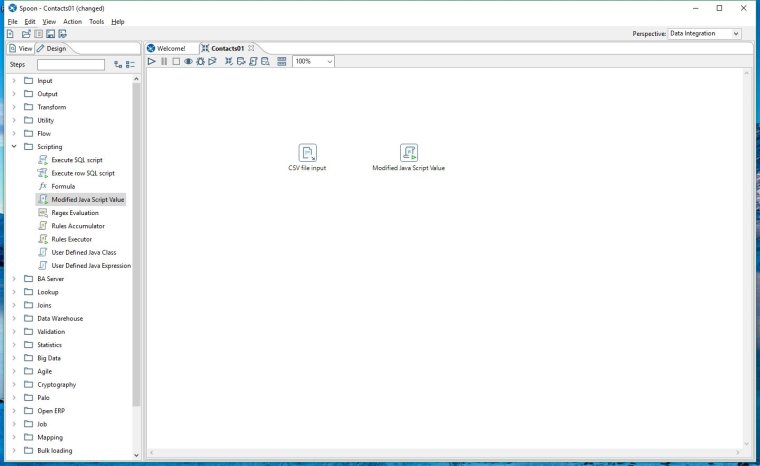
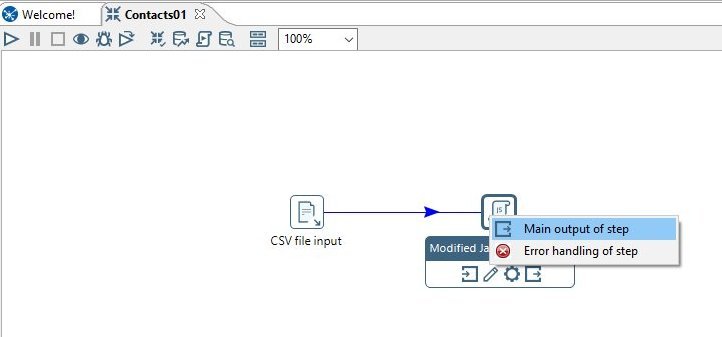
To connect the steps - hold shift & drag your mouse pointer from the CSV file input step towards the Modified Java Script Value icon. A line with directional arrow will appear and trun blue when it touches the new step. Release the mouse button and a menu appears - select "Main Output of Step" and the connection will now be in place. This connection is called a hop and it shows us the flow of data processing.
If you right click on our new Modified Java Script Value step and select Input Fields... you will be shown all the data fields that this step receives. Now close the fields window and lets move on.
Edit the new step by double clicking on it's icon. First let's change the step name to 'Build Message'
Now let's enter our single line of javascript. What we are doing is creating a javascript string variable that contains our message.
var msg = 'Hello ' + this["First Name"] + ' from ' + Company;
Note that 'First Name' and 'Company' are actual fields from the input step. A handy way to ensure you are using the correct names is to add them into the script by clicking on them from the list on the left.
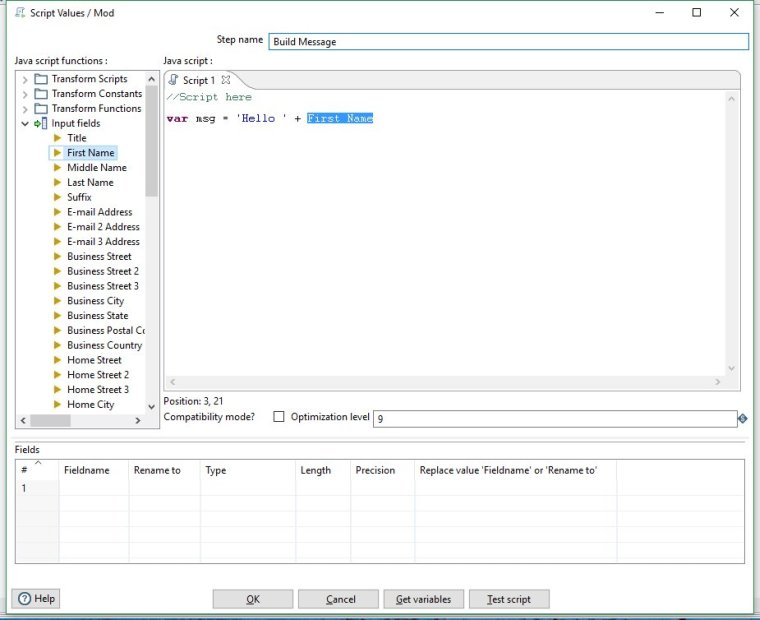
We had to use a little hack because one of our field names from the CSV file had a space in it. Javascript, like other languages doesn't allow variables with spaces so we wrapped the field name like this:
this["First Name"].
A better way to fix this problem would be to go back to our input step and edit the field names to ensure they do not contain spaces, but we can live with the hack for now.
We finish our statement with a semi colon because of course it's javascript.
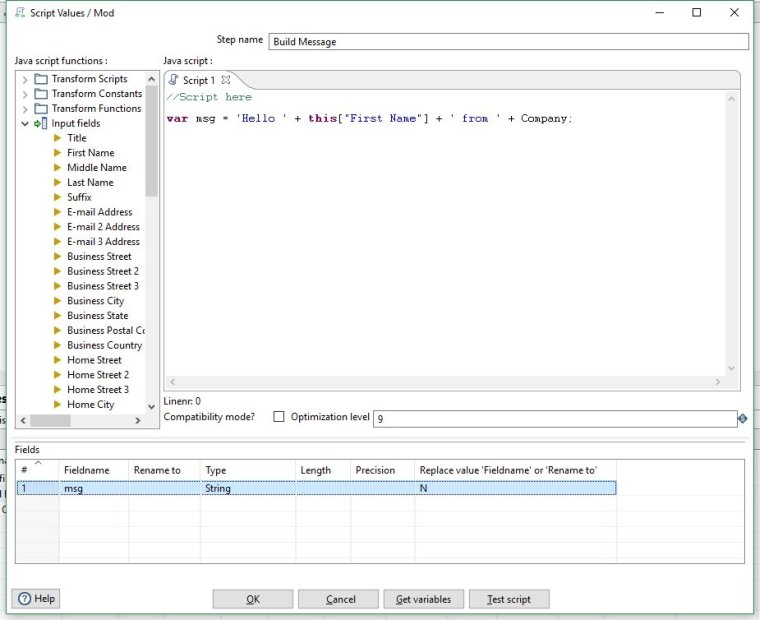
Now click the 'Get Variables' button at the bottom of the window - this adds the new variable called msg into the data flow.
You will see a new line appear in the Fields table with our new fieldname 'msg' and a type of String.
Your step properties should now look like this:
Click OK to close the Build Message step.
Now we want to add an output step to our data flow.
The Output Step
From the Output folder in the step palette select XML Output and drag it on to the workspace.
Create a hop from the Build Message step to the XML Output step like before by holding shift and draging from one step to the other. Select Main Output of Step when the option comes up.
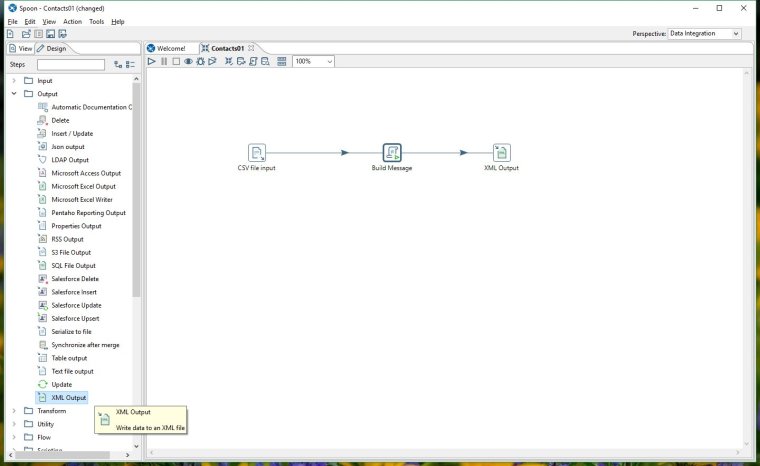
If you right click on our XML Output step and display Input Fields... you will see all the same fields in our data flow as before in addition to a new field: 'msg'. This shows that the new data generated in the Build Message step is being passed to this new step.
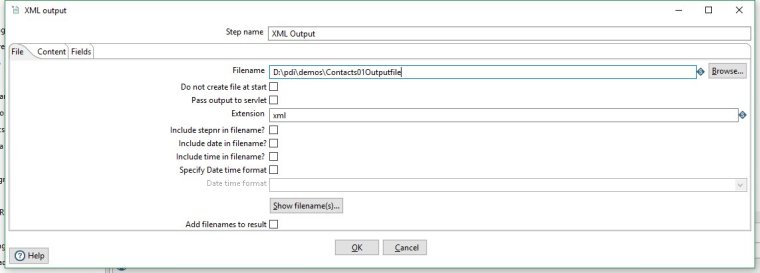
Close the Input Fields display and double click the XML Output step to edit it's properties.
In the Filename field enter a location and filename for the output file.
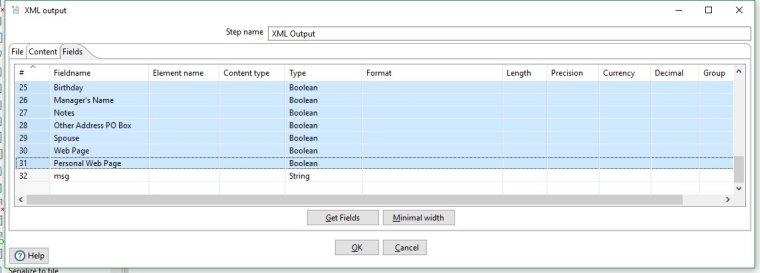
Move to the Fields tab and click on Get Fields. You will be presented with all the fields being passed to this step.
Lets delete all the fields we don't need and only keep our new msg field. The easiest way to do this is select the rows you don't want, by clicking on the row number column at left, and then hitting the delete key to remove them. You can shift + select large blocks of rows to quickly delete all the ones we don't want.
Now in the Content Type column click the cell and select the type 'Element' for our remaining field.
You should end up with a table that looks like this.
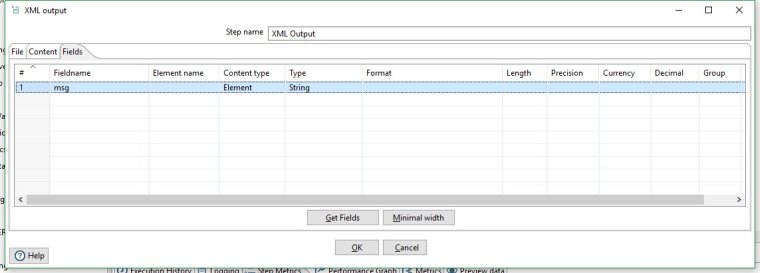
We're done with this step so click OK to close the XML Output step properties.
It's probably a good idea to save our transofrmation now. Select Save from the file menu or press CTRL + S on your keyboard.

Running Our Transformation
Now lets run our transformation. You can either click on the small triangle symbol at the top of the Contacts01 tab;
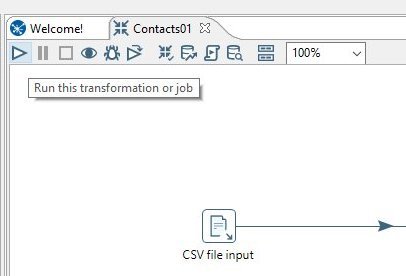
Press F9 on your keyboard or from the menu select:
Action -> Run
You will see a transformation execution window appear. All of the settings can be left as default - just check you are running locally.
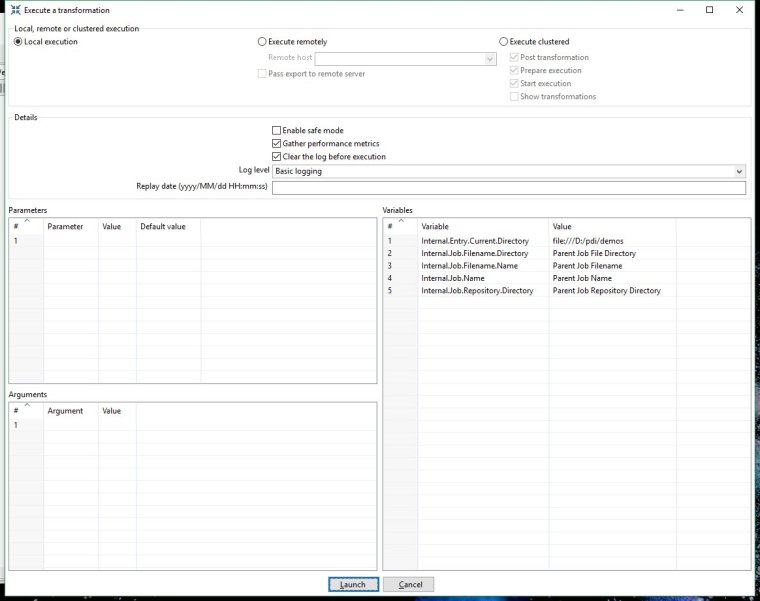
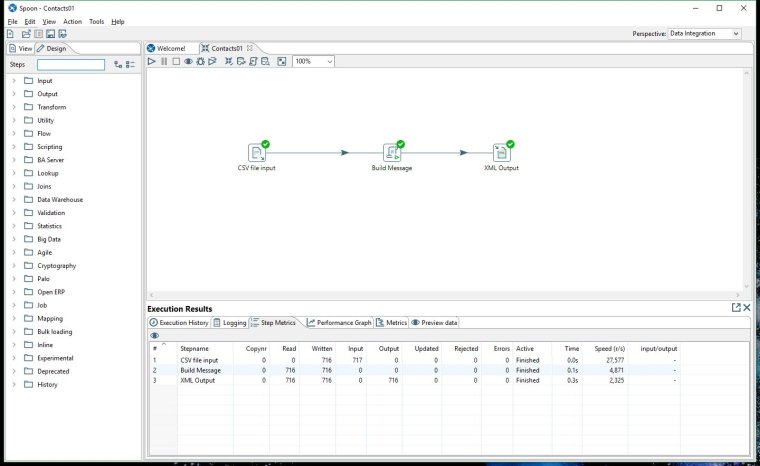
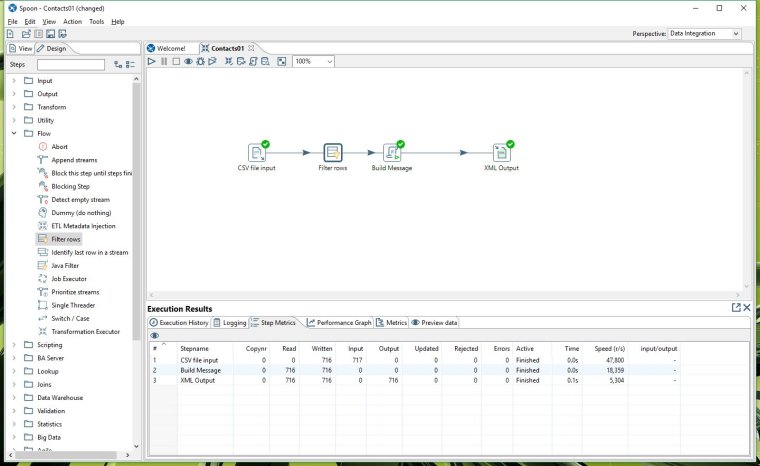
Click on the Launch button at the bottom of the window and you will be taken back to the transformation. Now there are some green ticks on our steps to show they executed without error. Also, some stats are shown in the bottom section of the Spoon window.
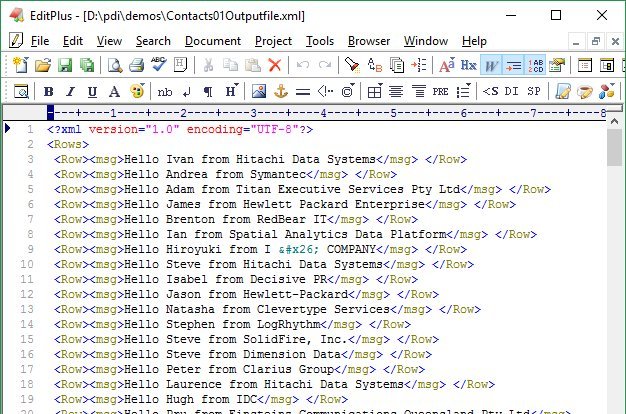
Go to your output file location and open the XML file in a text editor. It should look something like this:
Congrats, you have just built your first transformation with Pentaho Data Integration!
Before we wrap up lets add one more step to demonstrate a little more sophistication.
A Last Step To Fine Tune Our Data
In the steps palette open the Flow folder and drag the Filter Rows step and drop it onto the workspace.
Then drag the Filter Rows step and drop it onto the first hop so that you release it right on top of the blue line between CSV File Input and Build Message. You know you are in the right spot because the line will go bold when you are over it. When you realease a dialog box will ask if you want to split the hop. Reply yes to confirm.
Double click our Filter Rows step and configure it as follows. Send 'true' data onwards to our next step Build Message. If we wanted we could also send false data on to an alternate step but for now lets leave it blank which essentially discards it.
Under the condition, select the field we want to test as Job Title and change the boolean to CONTAINS. We want to search for a value rather than compare against another field so select the value box and enter a string field with a value of Director. It should look as follows: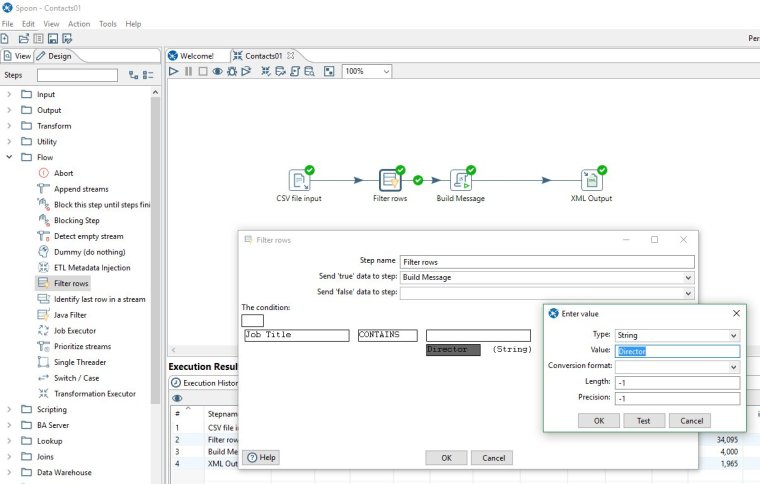
Click OK twice to save the step.
We have just created a test to check each row's Job Title and see if the string Director is present in it. If it is, the row gets sent on to the next step, if not it goes nowhere.
Now save your transformation again with CTRL+S and hit F9 to run.
Check your output XML file and notice the difference from the previous run. We have inserted some logic into our data flow to tailor our data and produce a nice, targeted list.
In Summary
By now you should start to see how transformations can be quite powerful in reading source data in one format, analysing it, manipulating it and then writing the results out in a different format.
This has been a simple linear transformation with only 4 steps but complex transformations can have many branches and parallel data flows.
The beauty of PDI is you design the transformations in a visual, schematic way. This is what Spoon does. Of course you will not be running ETL over millions of database rows in Spoon. Once you design and save your transformations you will be running them as background batch tasks, possibly distributed across a cluster of machines. That is another tutorial. As is presenting your output data through Pentaho pixel perfect reports and dashboards.
If you have any questions or want to discuss don't forget to hit me up on Twitter. I hope you've enjoyed this intro to PDI. I'd love to know how you go with your own PDI experiments.